One thing that has always bugged me about retirement calculations is the lack of detail in most of the retirement data and recommendations. Take for example, the 4% safe withdrawal rate that I?ve discussed here many times in the past. The 4% rule says that 4% is the maximum amount you can withdraw from your portfolio (based on a 60% stock, 40% bond), inflation adjusted, and be relatively assured that you won?t outlive your assets. Great, but what about the trade-offs? What about different allocations to stocks and bonds? How much risk should you expect? Hmmm, no real answers to those questions unless you sit down with an?adviser? pay them some money usually, and even then won?t get very good answers. At least not for me. So, I?ve spent the last few months building my own database of investment returns going back to 1929 to answer some of these questions. Lets take a look at what I?ve found so far.
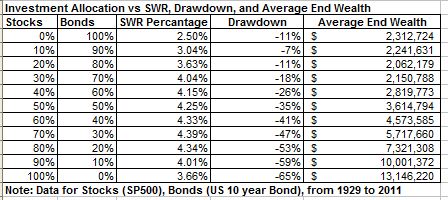
I had four big questions going into my analysis. For what investment allocation is the SWR the highest (is it really 60% stocks, 40% bonds)? How does a changing investment allocation impact the SWR? What risk am I taking for a given investment allocation? And what is the average end value of the retirement portfolio? I constructed a database of stock market returns (SP500), bond returns (US 10 year bond), and inflation (CPI) going back to 1929 and built annually re-balanced portfolios. Here are the results.
?
OK, lets take each question one by one. At what allocation is the SWR the highest? The answer is 70% stocks, 30% bonds which gives an SWR of 4.39%. How does a changing allocation impact the SWR? As the table shows, the investment allocation vs SWR relationship is a curve starting at a low of 2.5% for a 100% bond portfolio, climbing to a max of 4.39% at 70% stocks, and declining again to 3.66% at 100% stocks. More risk doesn?t always buy you more reward in retirement and vice versa. Next, lets look at risk. I like to look at risk in terms of max drawdown, i.e. what was the maximum peak to trough decline in the value of the portfolio during the retirement period. As you can see drawdown is pretty much directly correlated to how much you have allocated to stocks. For example, for the 70% stock portfolio, at one point during a 30 year retirement period the initial portfolio value declined by 47%. This was for the 1929 retiree. Lastly, even though by definition all the retirees had enough assets for a 30 year retirement, the average end values of the portfolios varied considerably. Again, via example, for a 70%/30% portfolio, the 4.39% SWR was solely determined by the 1966 retiree who ended up at the end of 30 years with $10,000 in assets, just making it through retirement. But on average, across all 54 30 year retirement periods studied, the average end value of the portfolios was $5.72 million. These are the assets that could be passed on to heirs, charities, etc? So, great you might say, now what?
Armed with more data now you can make better informed retirement planning decisions. While 70%/30% may give you the highest SWR, will you be able to emotionally withstand a potential drawdown of 47% in your portfolio? Or would you be able to sleep better at night with a 40%/60% allocation with a lower SWR of 4.15%, a drawdown of less than 20% but an average ending wealth of less than half of the 70%/30% portfolio. These are highly personal decisions and there is no one answer but I think they are critical parameters in deciding what?s best for your retirement assets.
Armed with more detailed investment allocation data and its impact on retirement can help retirees make better informed decisions more tailored to their individual desires and circumstances. Now that I?ve created my own personal database of historical returns I have reams of data the I hope to bring to bear on investing during retirement. Stay tuned for more. Please let me know if their are any particulars you?d like to see.
Like this:
Be the first to like this.
star jones wheres my refund photo of whitney houston in casket carrot top george huguely whitney houston casket photo match play championship
কোন মন্তব্য নেই:
একটি মন্তব্য পোস্ট করুন